Budget & Usage
QARK logs every token across every provider. Set monthly spending limits per provider, monitor costs in real time during streaming, and drill down into per-model breakdowns across your usage history. The cost ledger is append-only — entries persist even when you delete conversations.
Set Per-Provider Budgets
Section titled “Set Per-Provider Budgets”Configure a monthly USD spending limit for each provider individually:
- Open Settings → Budget & Usage.
- Each configured provider displays a budget input field.
- Enter a dollar amount (e.g.,
50.00for $50/month). The value commits on blur or when you press Enter. - Toggle the Enforce switch to control whether QARK blocks requests when the budget is exceeded.
| Enforcement State | Behavior |
|---|---|
| Enabled | Streaming stops and new requests are blocked once the monthly limit is reached |
| Disabled | Costs are tracked and warnings are shown, but requests continue without interruption |
Set different limits for different providers — $100/month for your primary cloud provider, $20/month for a secondary one, unlimited for local models.
Real-Time Per-Message Cost Breakdown
Section titled “Real-Time Per-Message Cost Breakdown”Every message displays a detailed cost breakdown:
| Metric | Description |
|---|---|
| Input tokens | Tokens sent to the model (prompt + context) |
| Output tokens | Tokens generated by the model |
| Thinking tokens | Tokens consumed by the reasoning/thinking step (tracked and priced separately for native-thinking models like Claude) |
| Cost (USD) | Calculated cost based on the model’s per-token pricing |
Compaction and compression operations (context window management) are tracked as separate cost entries with a purpose field distinguishing them from regular message costs.
The Cost Ledger
Section titled “The Cost Ledger”Every cost event is written to an append-only ledger. Each record contains:
| Field | Description |
|---|---|
id | Unique record identifier |
conversation_id | Which conversation generated this cost |
message_id | Which message generated this cost |
provider | Provider name (e.g., Anthropic, OpenAI, Google) |
model | Specific model identifier |
tokens_in | Input token count |
tokens_out | Output token count |
tokens_thinking | Thinking/reasoning token count |
cost_usd | Calculated cost in USD |
purpose | message, compaction, compression, or other operation type |
timestamp | When the cost was incurred |
Budget Warnings and Enforcement
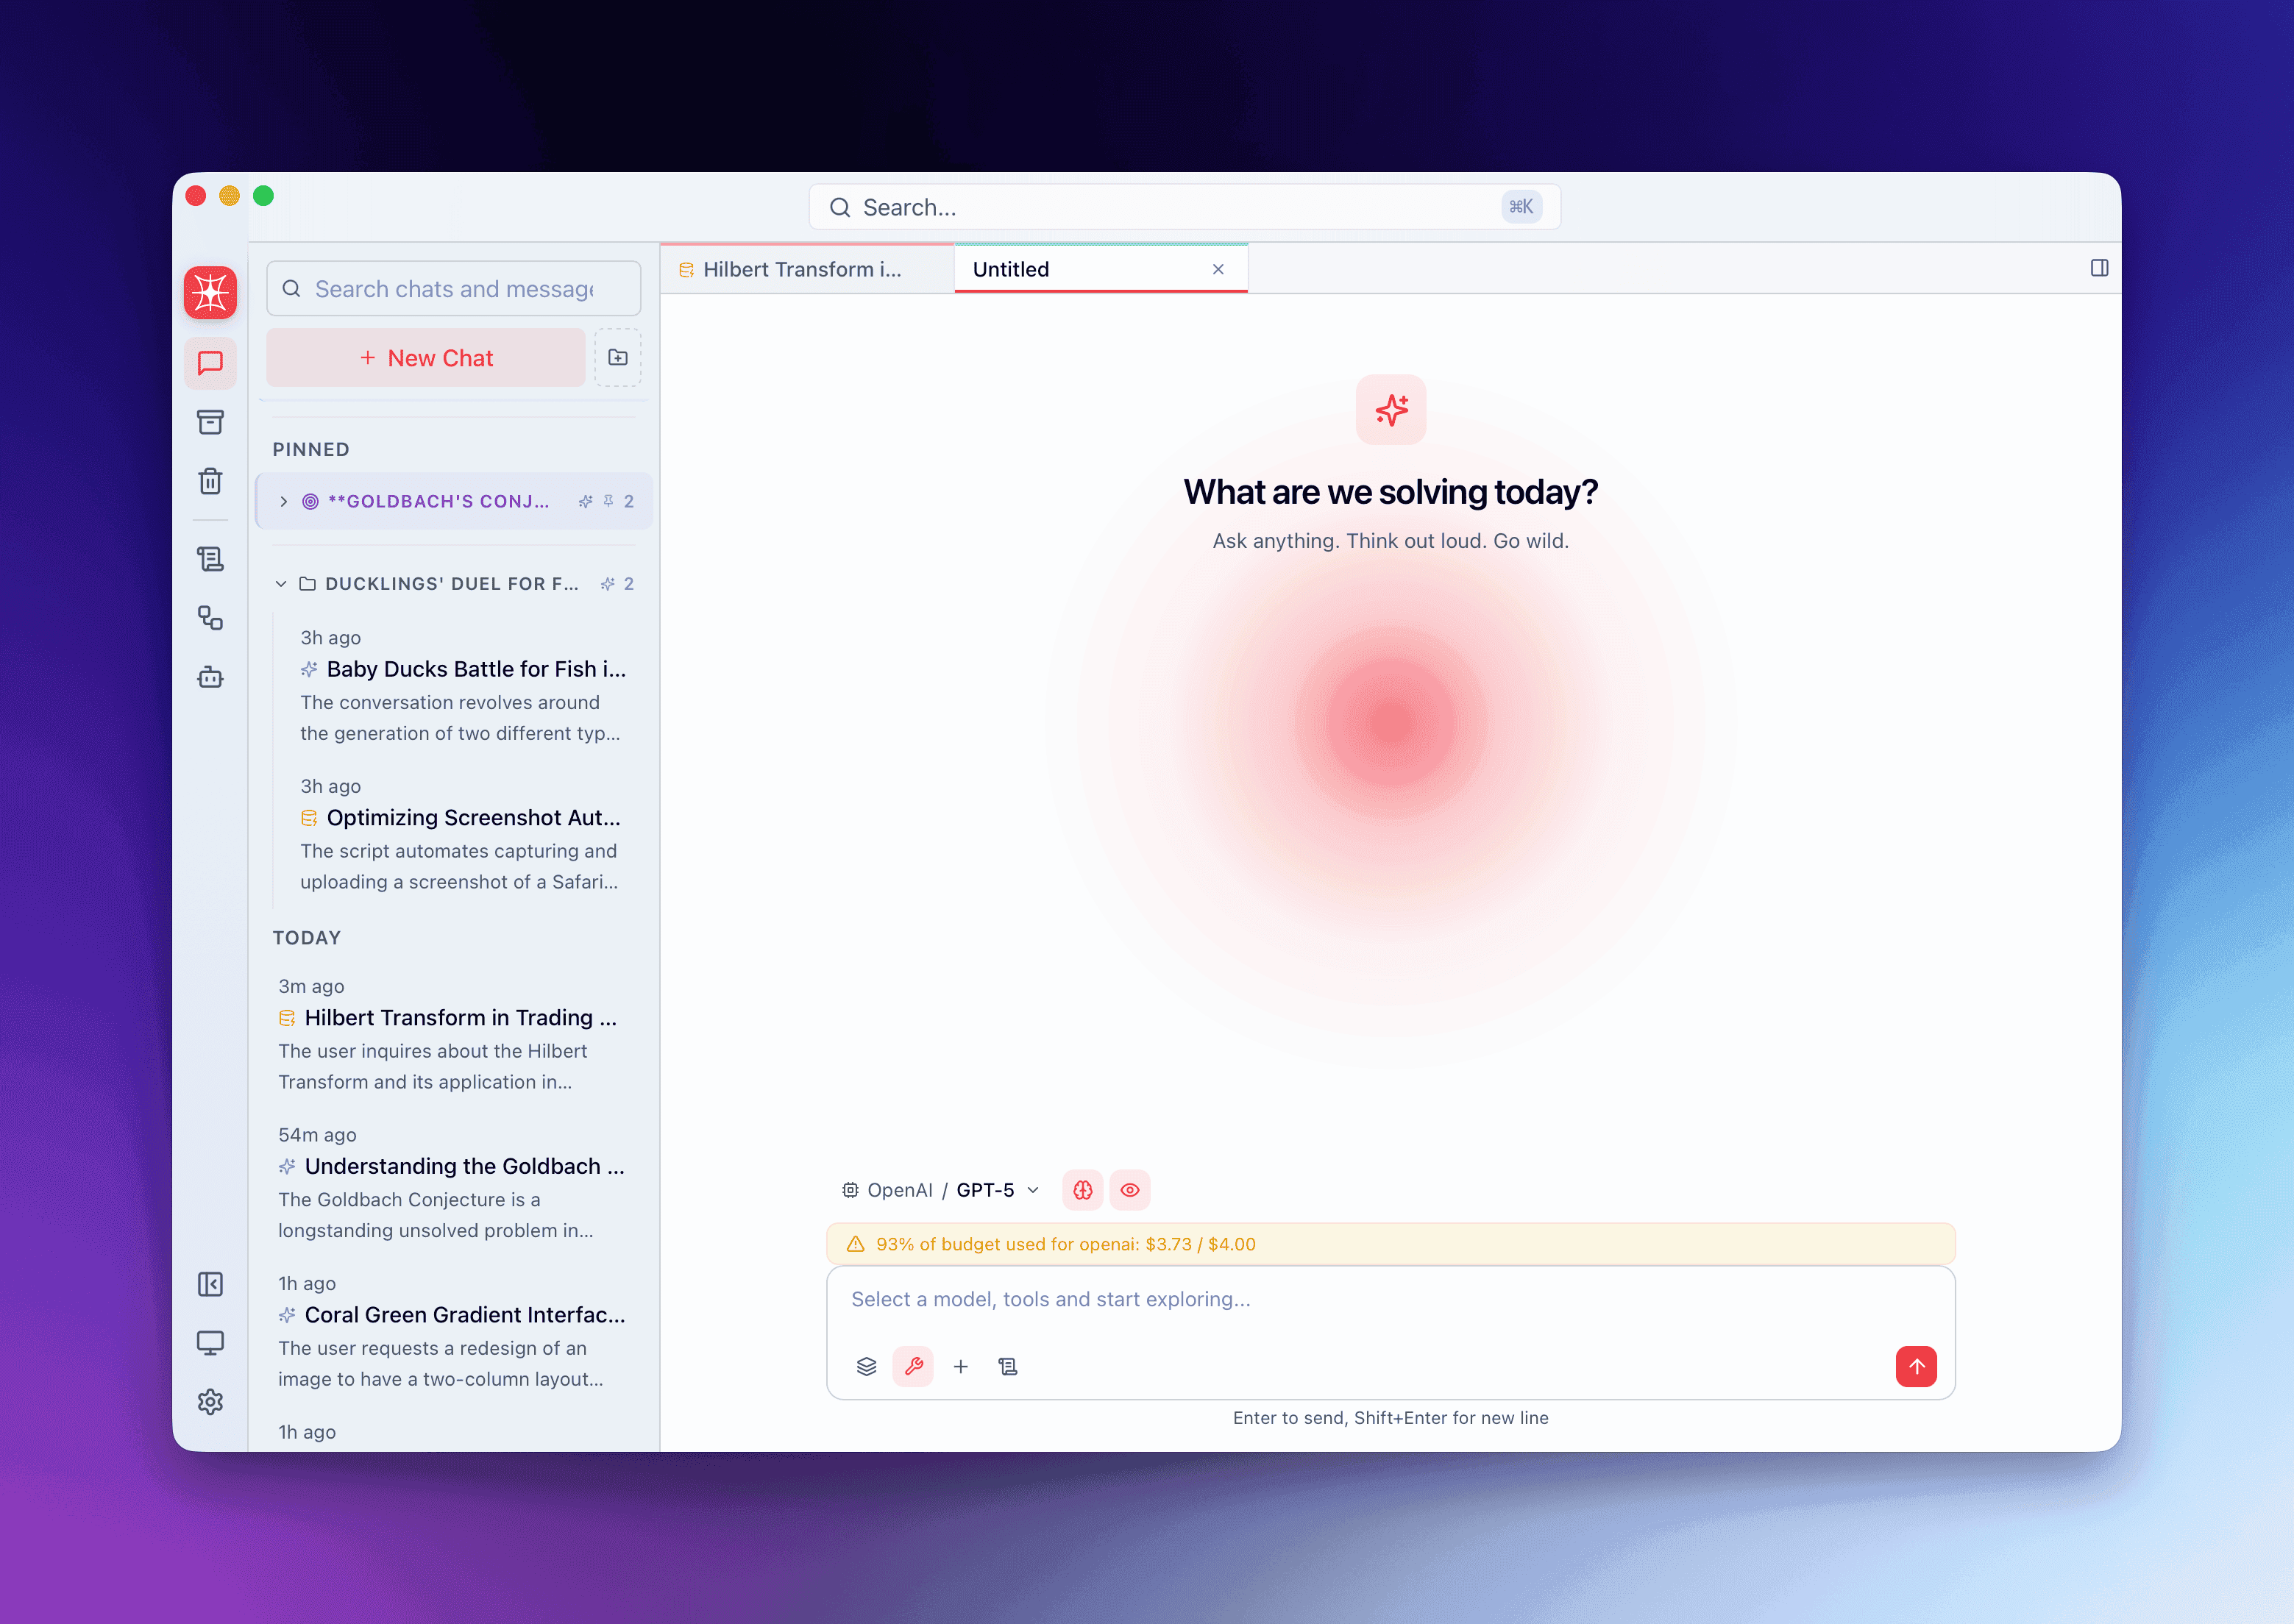
Section titled “Budget Warnings and Enforcement”QARK monitors spending against your configured limits during streaming:
- Warning threshold (80%): When a provider’s monthly spending reaches 80% of its budget, a warning notification appears.
- Budget exceeded (100%): If enforcement is enabled,
check_provider_budgetreturnsallowed=falseand streaming stops immediately. A clear message explains which provider hit its limit and what the current spend is.
Warnings are emitted in real time — you’ll see them during an active stream if a response pushes spending past the threshold.
Dashboard
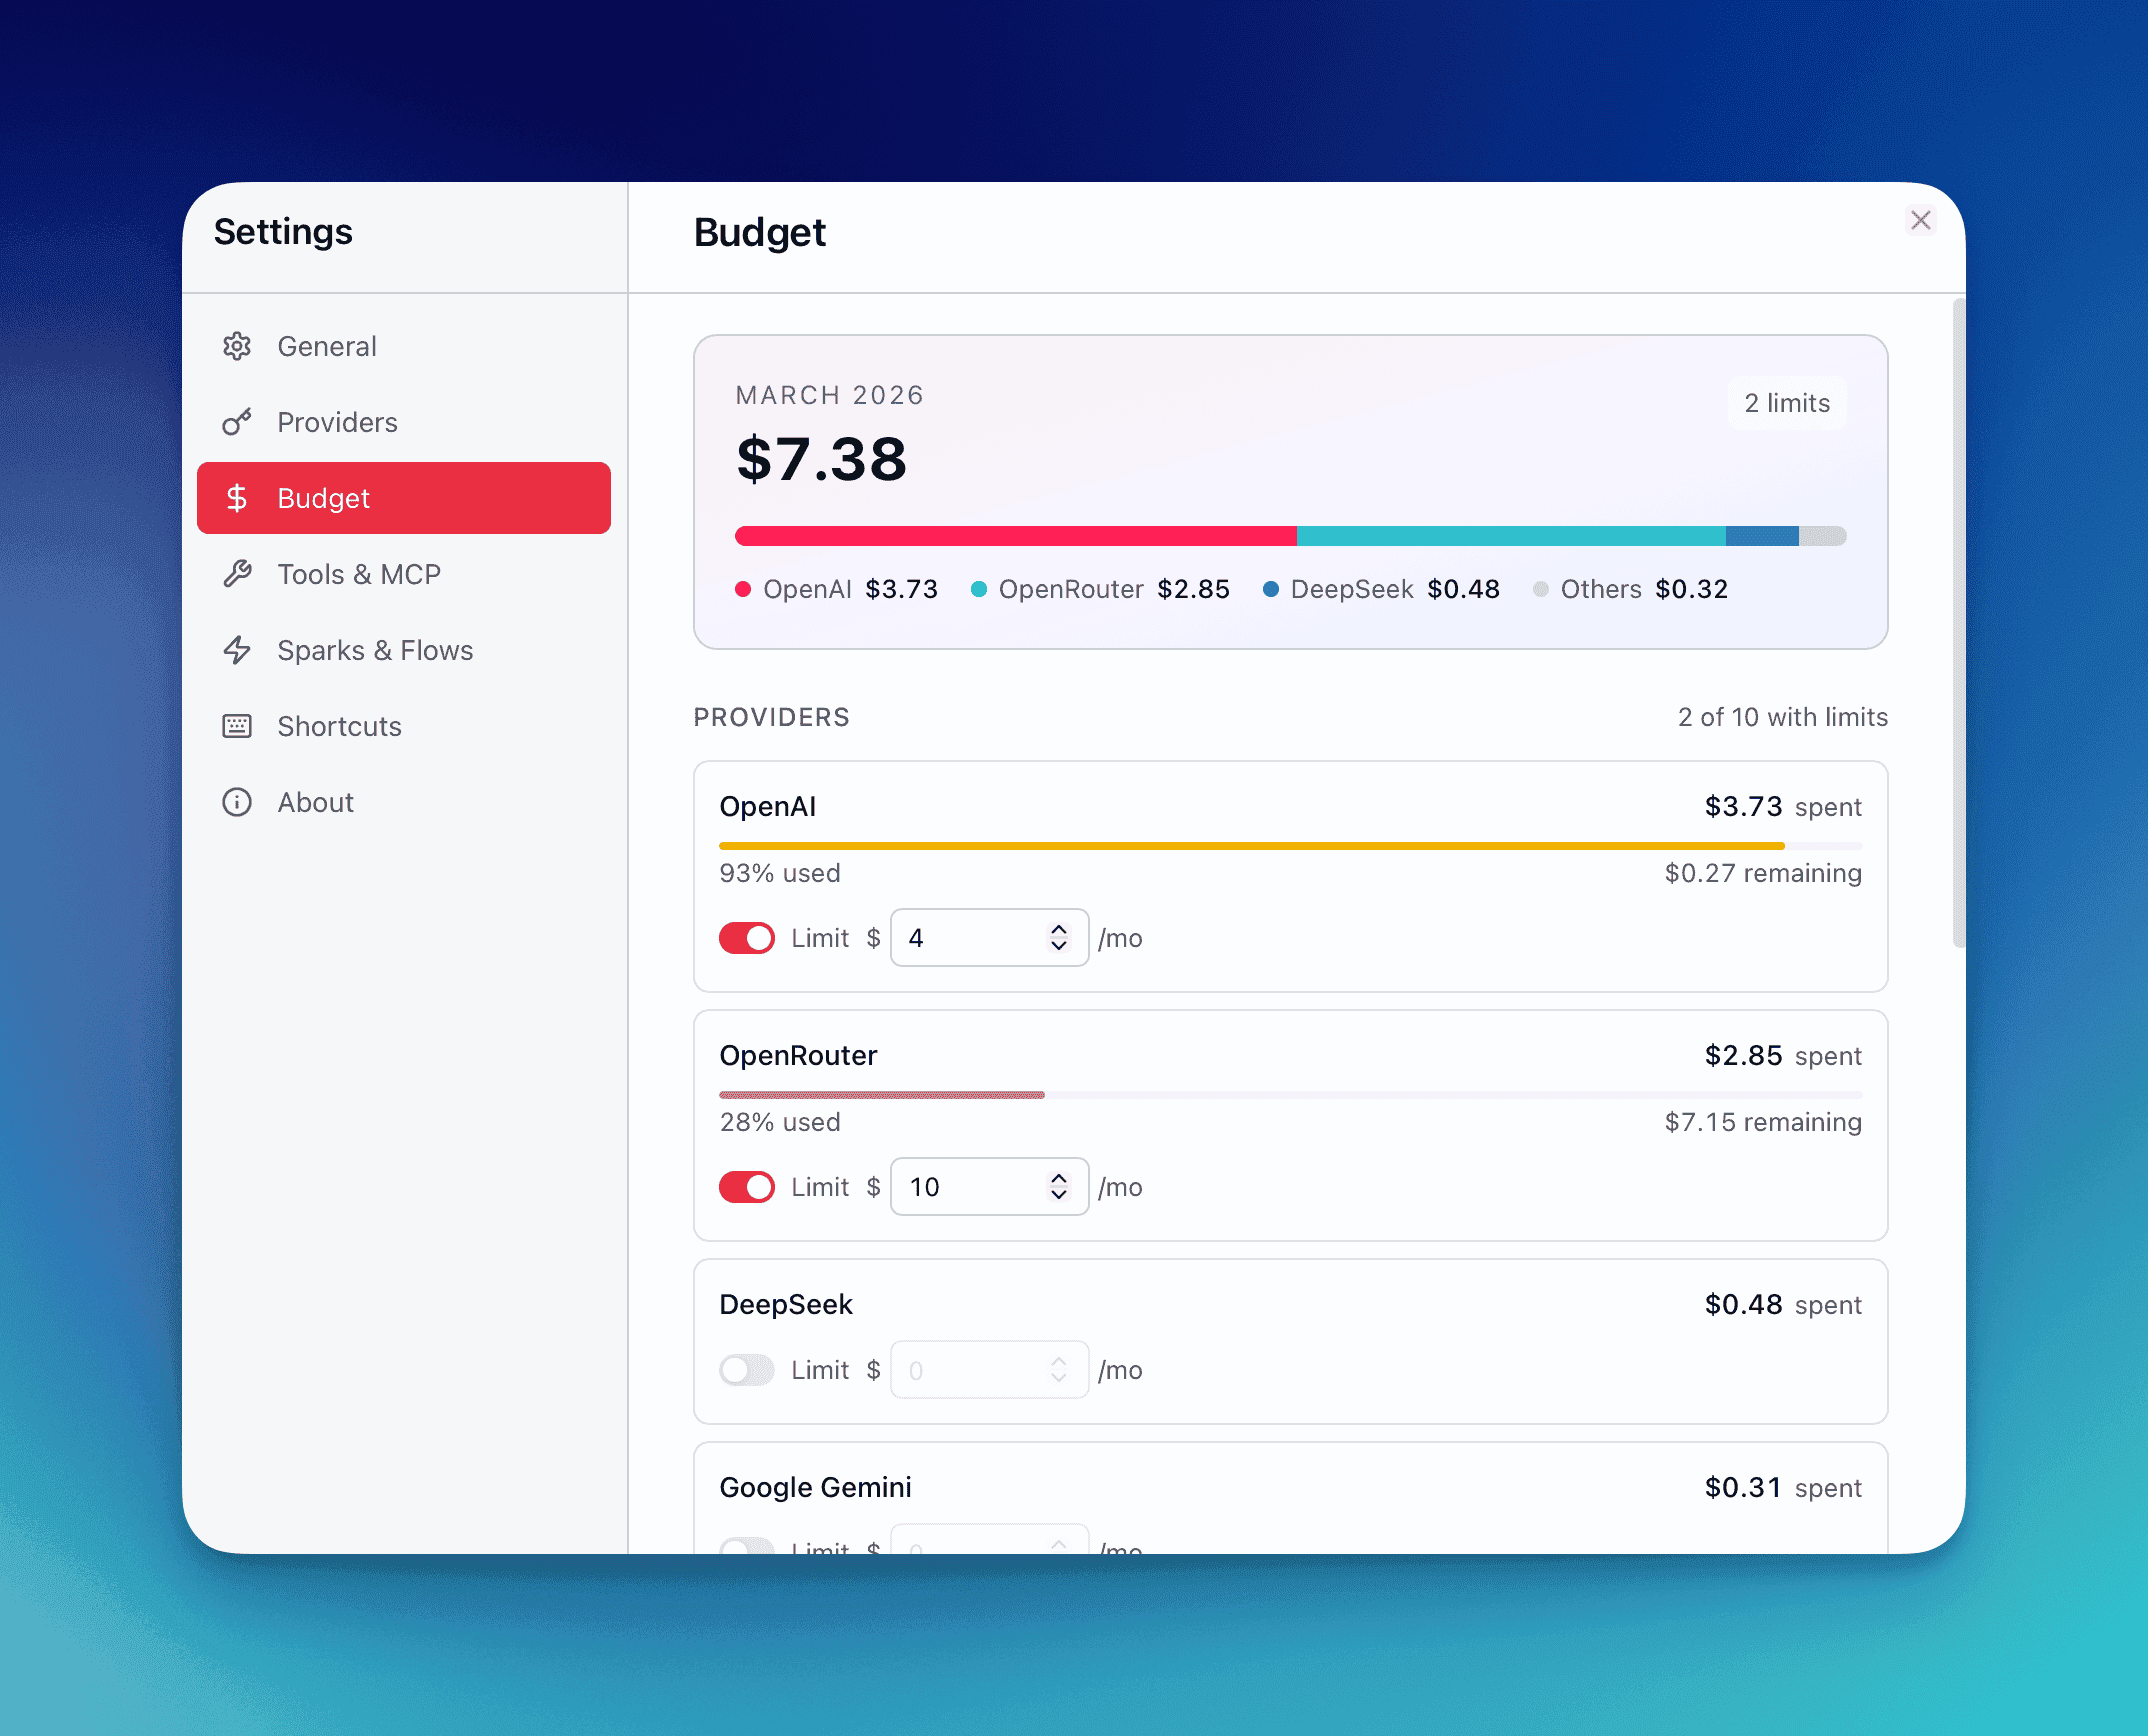
Section titled “Dashboard”The Budget & Usage dashboard provides a visual overview of your spending patterns.
Current Month Summary
Section titled “Current Month Summary”A summary card at the top shows:
- Total spending this month across all providers
- Stacked bar chart breaking down the top 3 provider spenders plus an “Others” bucket (8-color rotation palette)
Past Months Timeline
Section titled “Past Months Timeline”Below the current month, the last 3 months are displayed as expandable sections:
| Element | Description |
|---|---|
| Month header | Month name + total spend |
| Trending indicator | Percentage change vs. previous month (▲ up / ▼ down) |
| Provider breakdown | Mini progress bars per provider showing cost, message count, and percentage of the month’s total |
Click any month to expand its full provider-level breakdown.
Provider Cards
Section titled “Provider Cards”Below the timeline, each provider gets a dedicated card sorted by spending (highest first):
| Visual State | Condition |
|---|---|
| Primary color bar | Spending below 80% of budget |
| Yellow bar | Spending between 80%–99% of budget |
| Red bar | Spending at or above 100% of budget |
Each card displays: current spend, budget limit, remaining budget, and a progress bar.
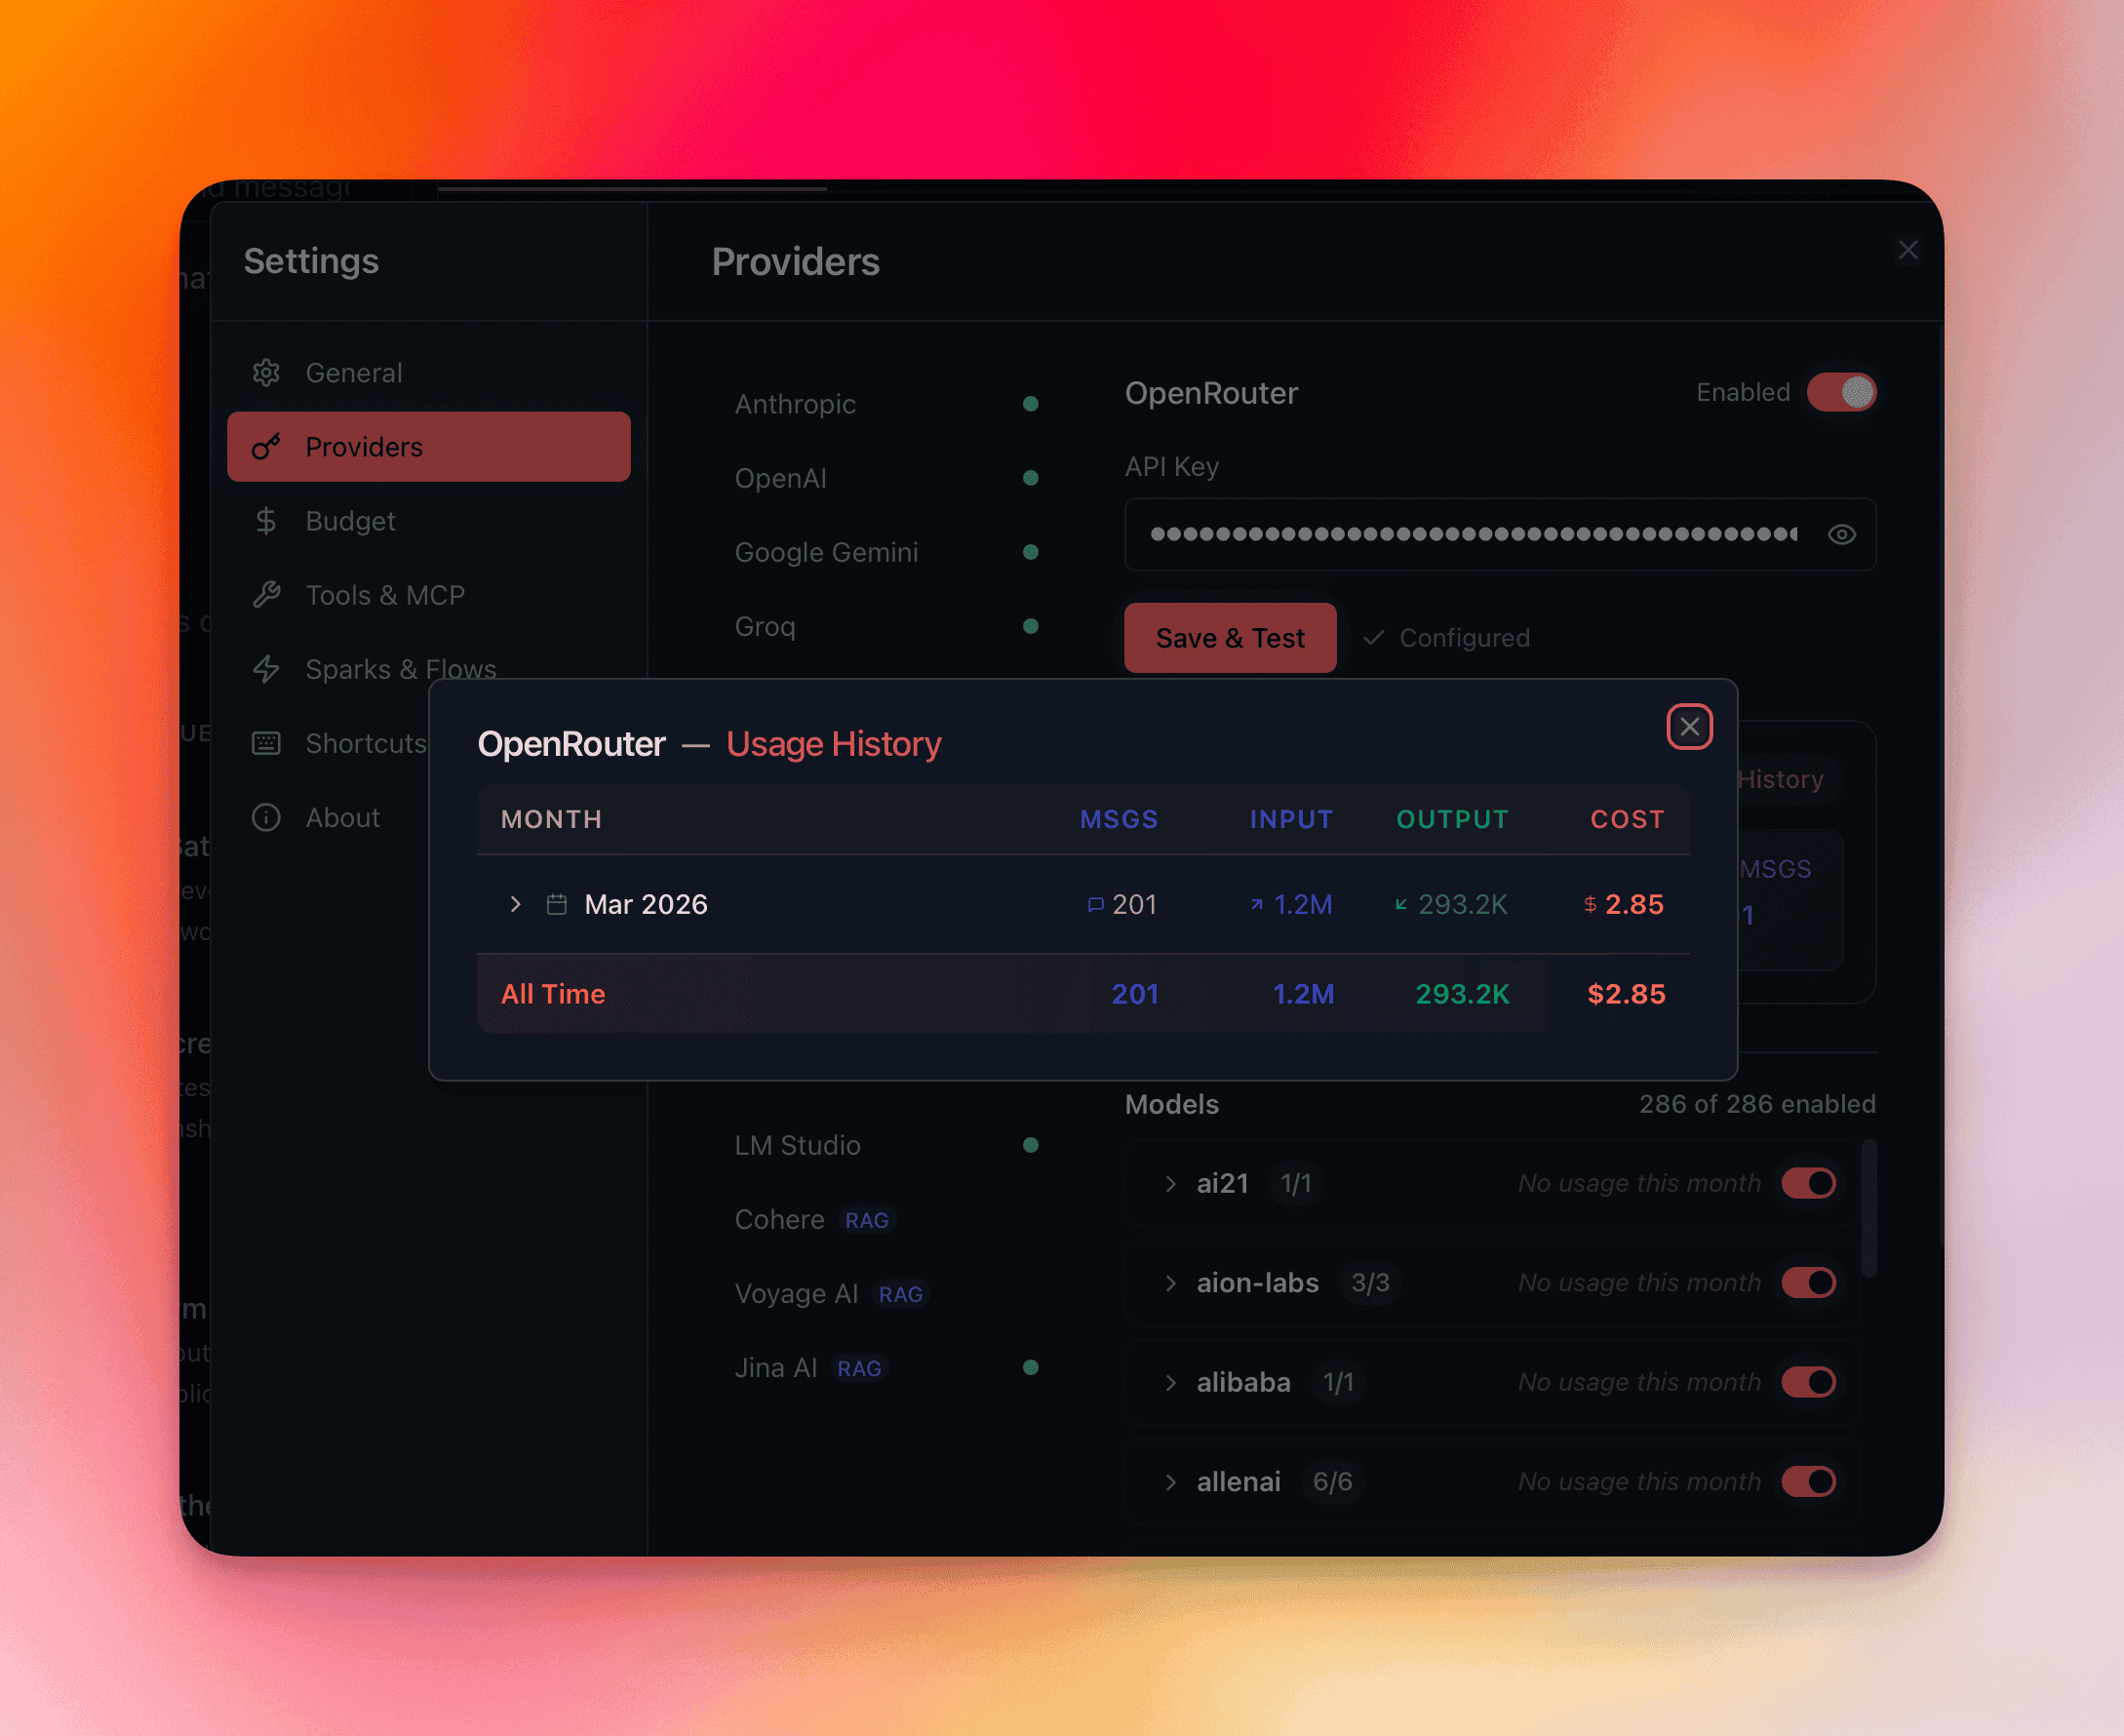
Usage History
Section titled “Usage History”Open the Usage History modal from the dashboard for a detailed tabular view:
Table Columns
Section titled “Table Columns”| Column | Description |
|---|---|
| Month | Calendar month |
| Messages | Total message count |
| Input Tokens | Total input tokens consumed |
| Output Tokens | Total output tokens generated |
| Cost | Total USD spent |
Expandable Rows
Section titled “Expandable Rows”Click any month row to expand a model-level breakdown sorted by cost (highest first). Each sub-row shows the model name, message count, token counts, and cost — so you can identify exactly which models drive your spending.
All-Time Footer
Section titled “All-Time Footer”The table footer displays cumulative totals across your entire usage history: total messages, total tokens (input + output), and total cost.
Per-Conversation Cost
Section titled “Per-Conversation Cost”Every conversation tracks its own cumulative cost. Open the Info panel for any conversation to see:
- Total cost for that conversation
- Token counts (input, output, thinking)
- Number of messages
- Provider/model usage breakdown
Token Estimation During Streaming
Section titled “Token Estimation During Streaming”While a response is actively streaming, QARK displays an estimated token count calculated as:
estimated_tokens = content.length / 4This estimate updates in real time and is replaced by the exact token count from the provider’s response metadata once streaming completes.
Reduce Your Costs
Section titled “Reduce Your Costs”| Strategy | Impact |
|---|---|
| Use affordable models for drafts | Route first-pass writing, brainstorming, and iteration to cheaper models. Switch to premium models for final output. |
| Run local models for zero-cost tasks | Ollama, LM Studio, and other local providers incur no API cost. Use them for repetitive tasks, formatting, and exploration. |
Set token_budget context strategy | Apply a hard token cap per conversation to prevent runaway context growth. Older messages are compacted when the cap is reached. |
| Monitor the dashboard weekly | Catch unexpected cost spikes early. The month-over-month trending indicator highlights changes before they compound. |